Financial reporting that is right straight away.
Profit and loss, balance sheet, cash flow and dashboards, each compared with last year, budget or the previous period. Easyclose builds your financial reporting automatically from your imported figures, with drill-down to the entry line so you can substantiate every item. You set up the reporting structure once and every month the report stands ready immediately. Works with every accounting package.
What is financial reporting?
Financial reporting is presenting a company's figures in a clear, structured way, so that the board, the owner, the bank or the accountant sees at a glance how the business is doing. The core consists of the profit and loss account (the result over a period), the balance sheet (assets and liabilities at a point in time) and the cash flow (where the money comes from and where it goes).
Figures only gain meaning in comparison. A good management report sets the result against last year, against the budget and against the previous period, so you see not only what the numbers are, but also whether they are better or worse than expected. And every item must be traceable: from a total you must be able to click back to the underlying entries. Reporting follows the month-end close: only when the figures are right is the report reliable.
Profit and loss
The result over the period: revenue, costs and the margin in between, per category and per general ledger account.
Balance sheet
Assets and liabilities at a reference date. If the balance sheet balances, the accounts are internally consistent.
Cash flow
Where the money comes from and what it goes to, so you watch liquidity alongside the result.
The financial reports at a glance
As soon as your figures are imported and the accounts are mapped to your reporting structure, the complete set of reports stands ready. You set it up once, and every following month the report rolls out by itself.
You decide the layout of your reporting yourself with your own reporting structure for P&L and balance sheet. Choose a ready-made template (Dutch GAAP (RJ), IFRS or industry-specific) or build your own categories, and map the general ledger accounts by dragging, or let the AI propose the mapping. You can also build dashboards yourself, with draggable widgets.
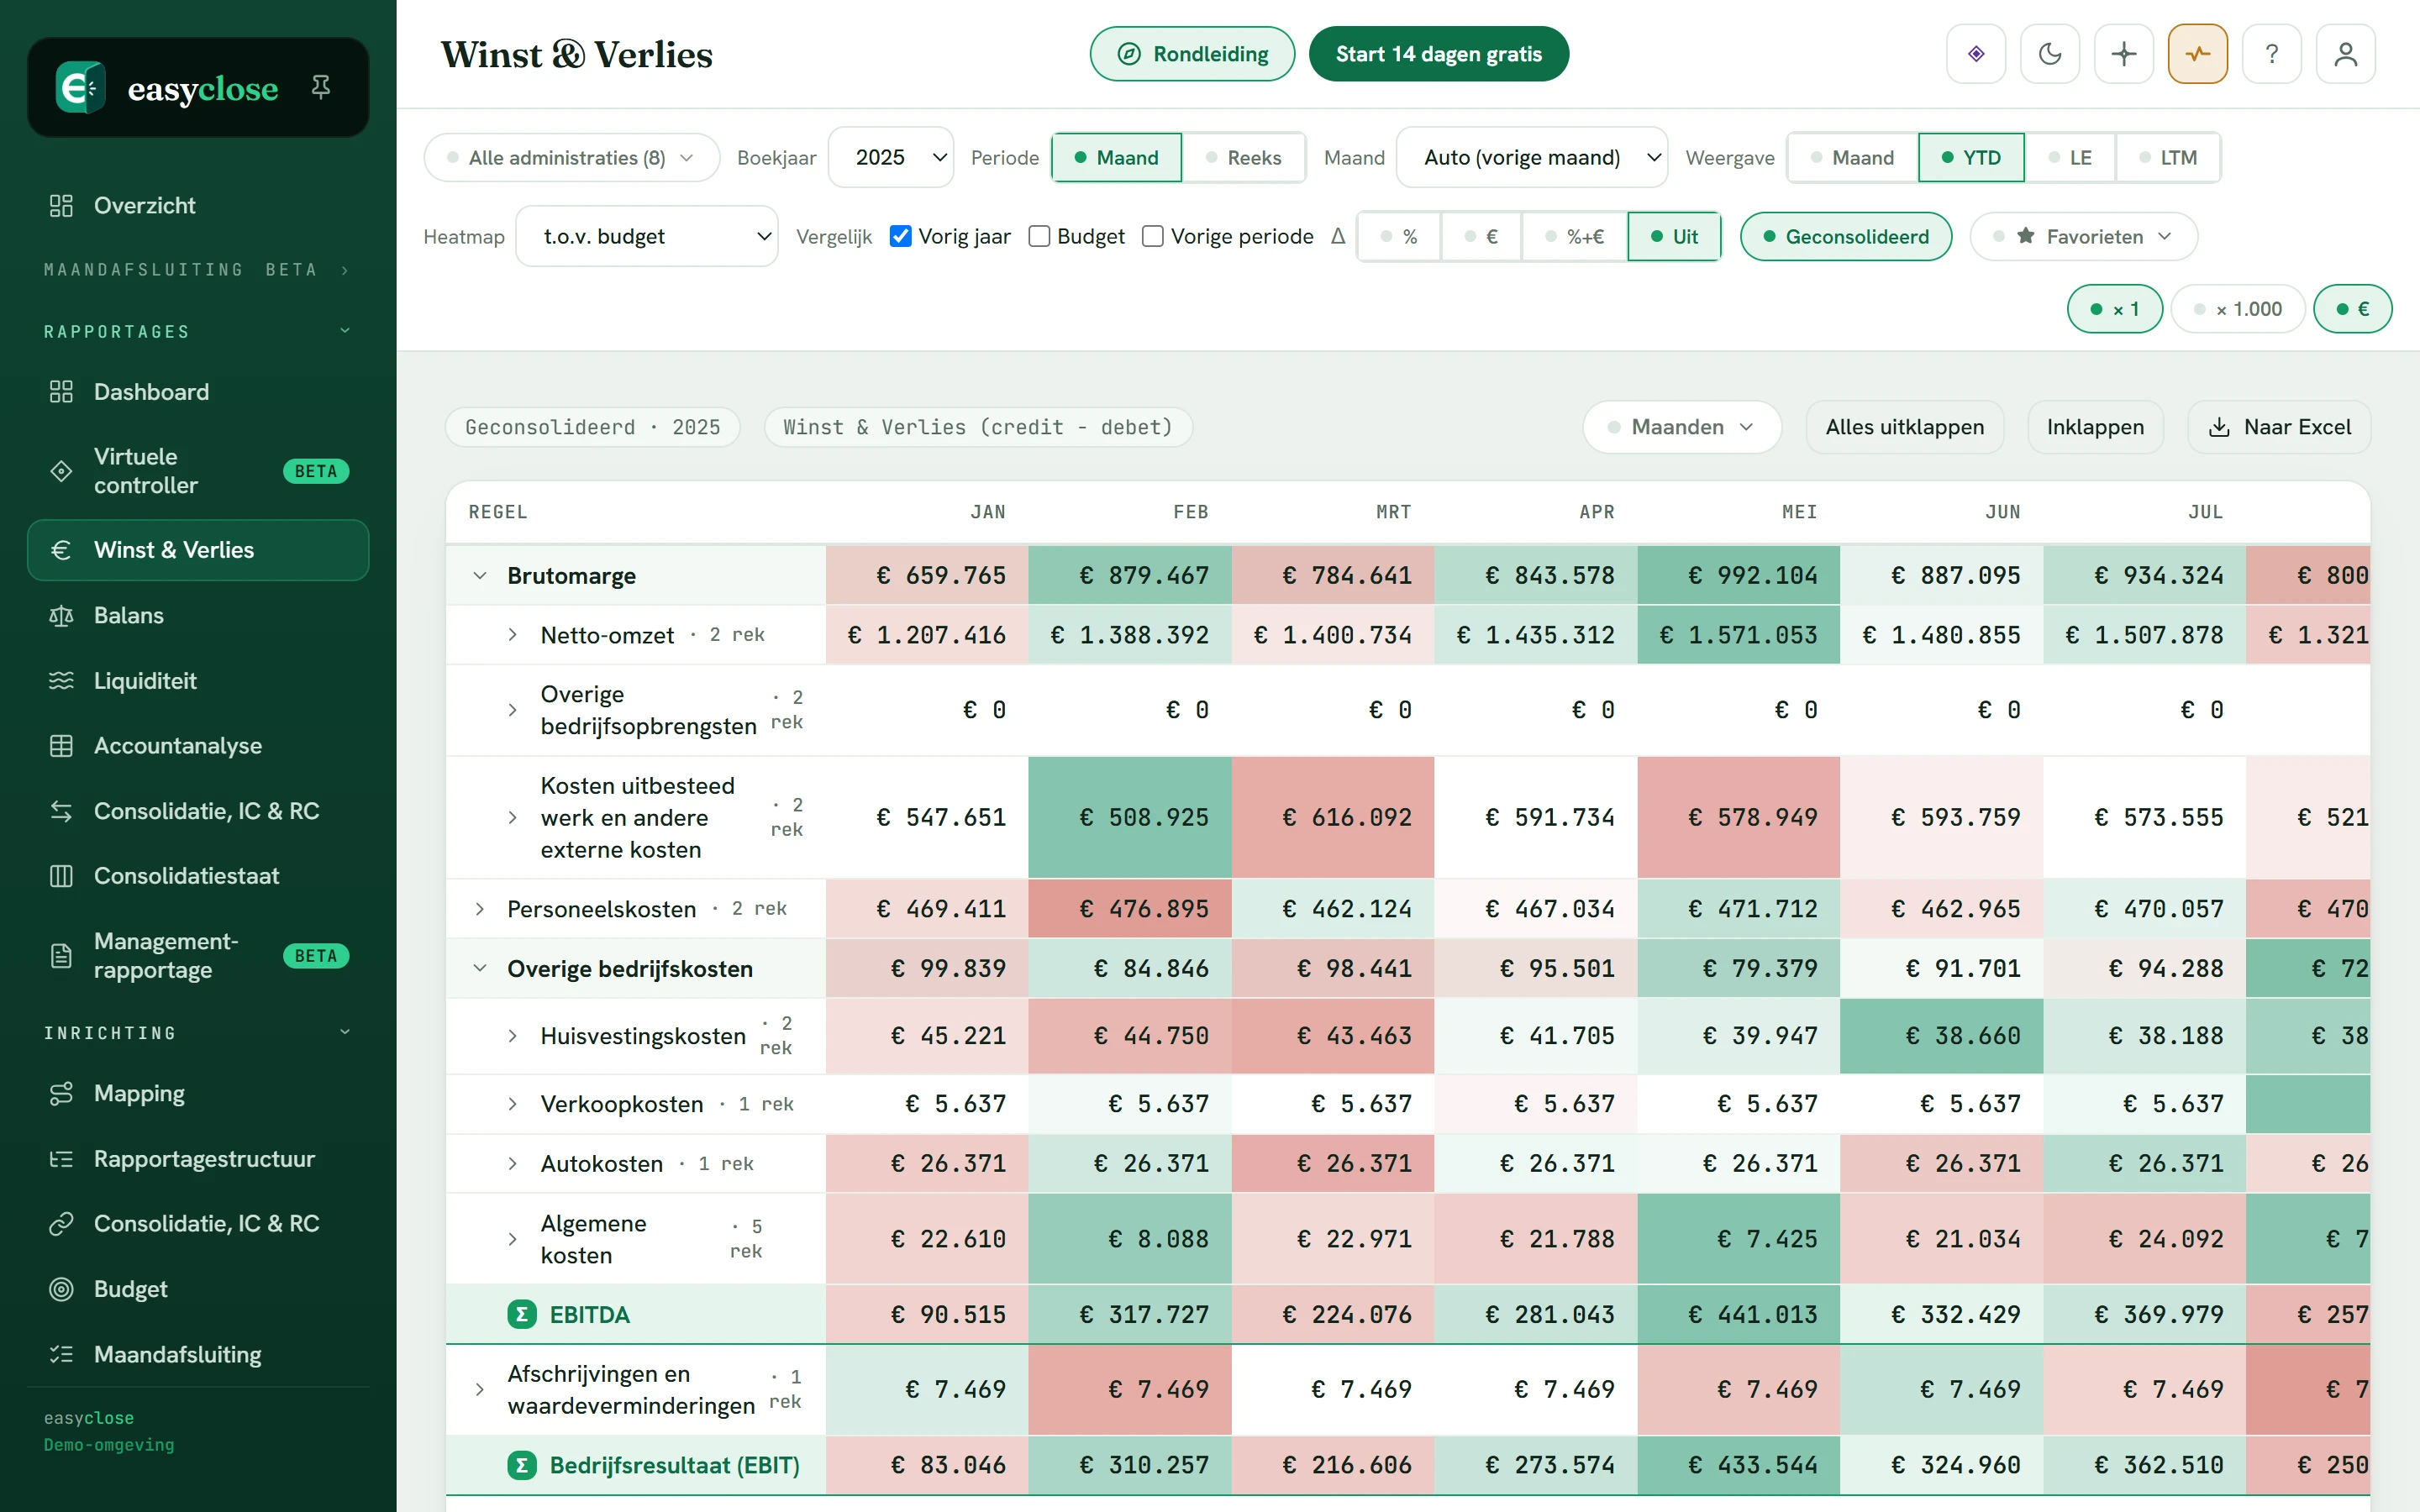
The P&L with heatmap, live
This is the real profit and loss account from the demo: every month colours green or red against the budget, and every amount clicks through to the entry line.
See it in the demo →Comparing with last year, budget and period
A number without context says little. In Easyclose the comparison sits next to every report line: against the same period last year, against the budget or against the previous period. At the top you choose whether you look at a single month, cumulatively (year to date) or over the last twelve months. The differences are colour-weighted by favourability, so falling costs colour green and falling revenue red, regardless of the sign of the number.
See the development
Every item next to the same period a year earlier, so growth and decline are immediately visible.
Plan versus actuals
Compare with your budget or scenario and see per category where you are ahead or behind.
Variances jump out
A colour matrix per month and category points out the notable items at a glance, down to general ledger level.
Read more about budgeting and scenarios on compare & budget.
Drill-down: from report line to the entry
The difference between a pretty picture and a report you can build on sits in the drill-down. In Easyclose every amount is clickable: from a category to the general ledger accounts underneath, and from an account to the individual entry lines, including date, journal, description and counterparty. That way you explain a variance immediately, without diving into the bookkeeping, and you substantiate every item for the board or the accountant.
From figures to a management report
A management report is more than a table: it is a story with the key figures, the main variances and a short commentary. Easyclose brings the dashboard, the P&L, the balance sheet and the cash flow together in one place, with the comparisons included, so that instead of gathering figures you keep time to interpret them. You share the report within your team or export the tables to Excel for your own layout.
Key figures first
A dashboard with the KPIs that matter to your business, with comparison chips and charts.
Interpret, do not gather
Because the figures and comparisons stand ready, your time goes to the story behind the variances.
To Excel or your file
Export every large table to Excel, or use the drill-down to substantiate items.
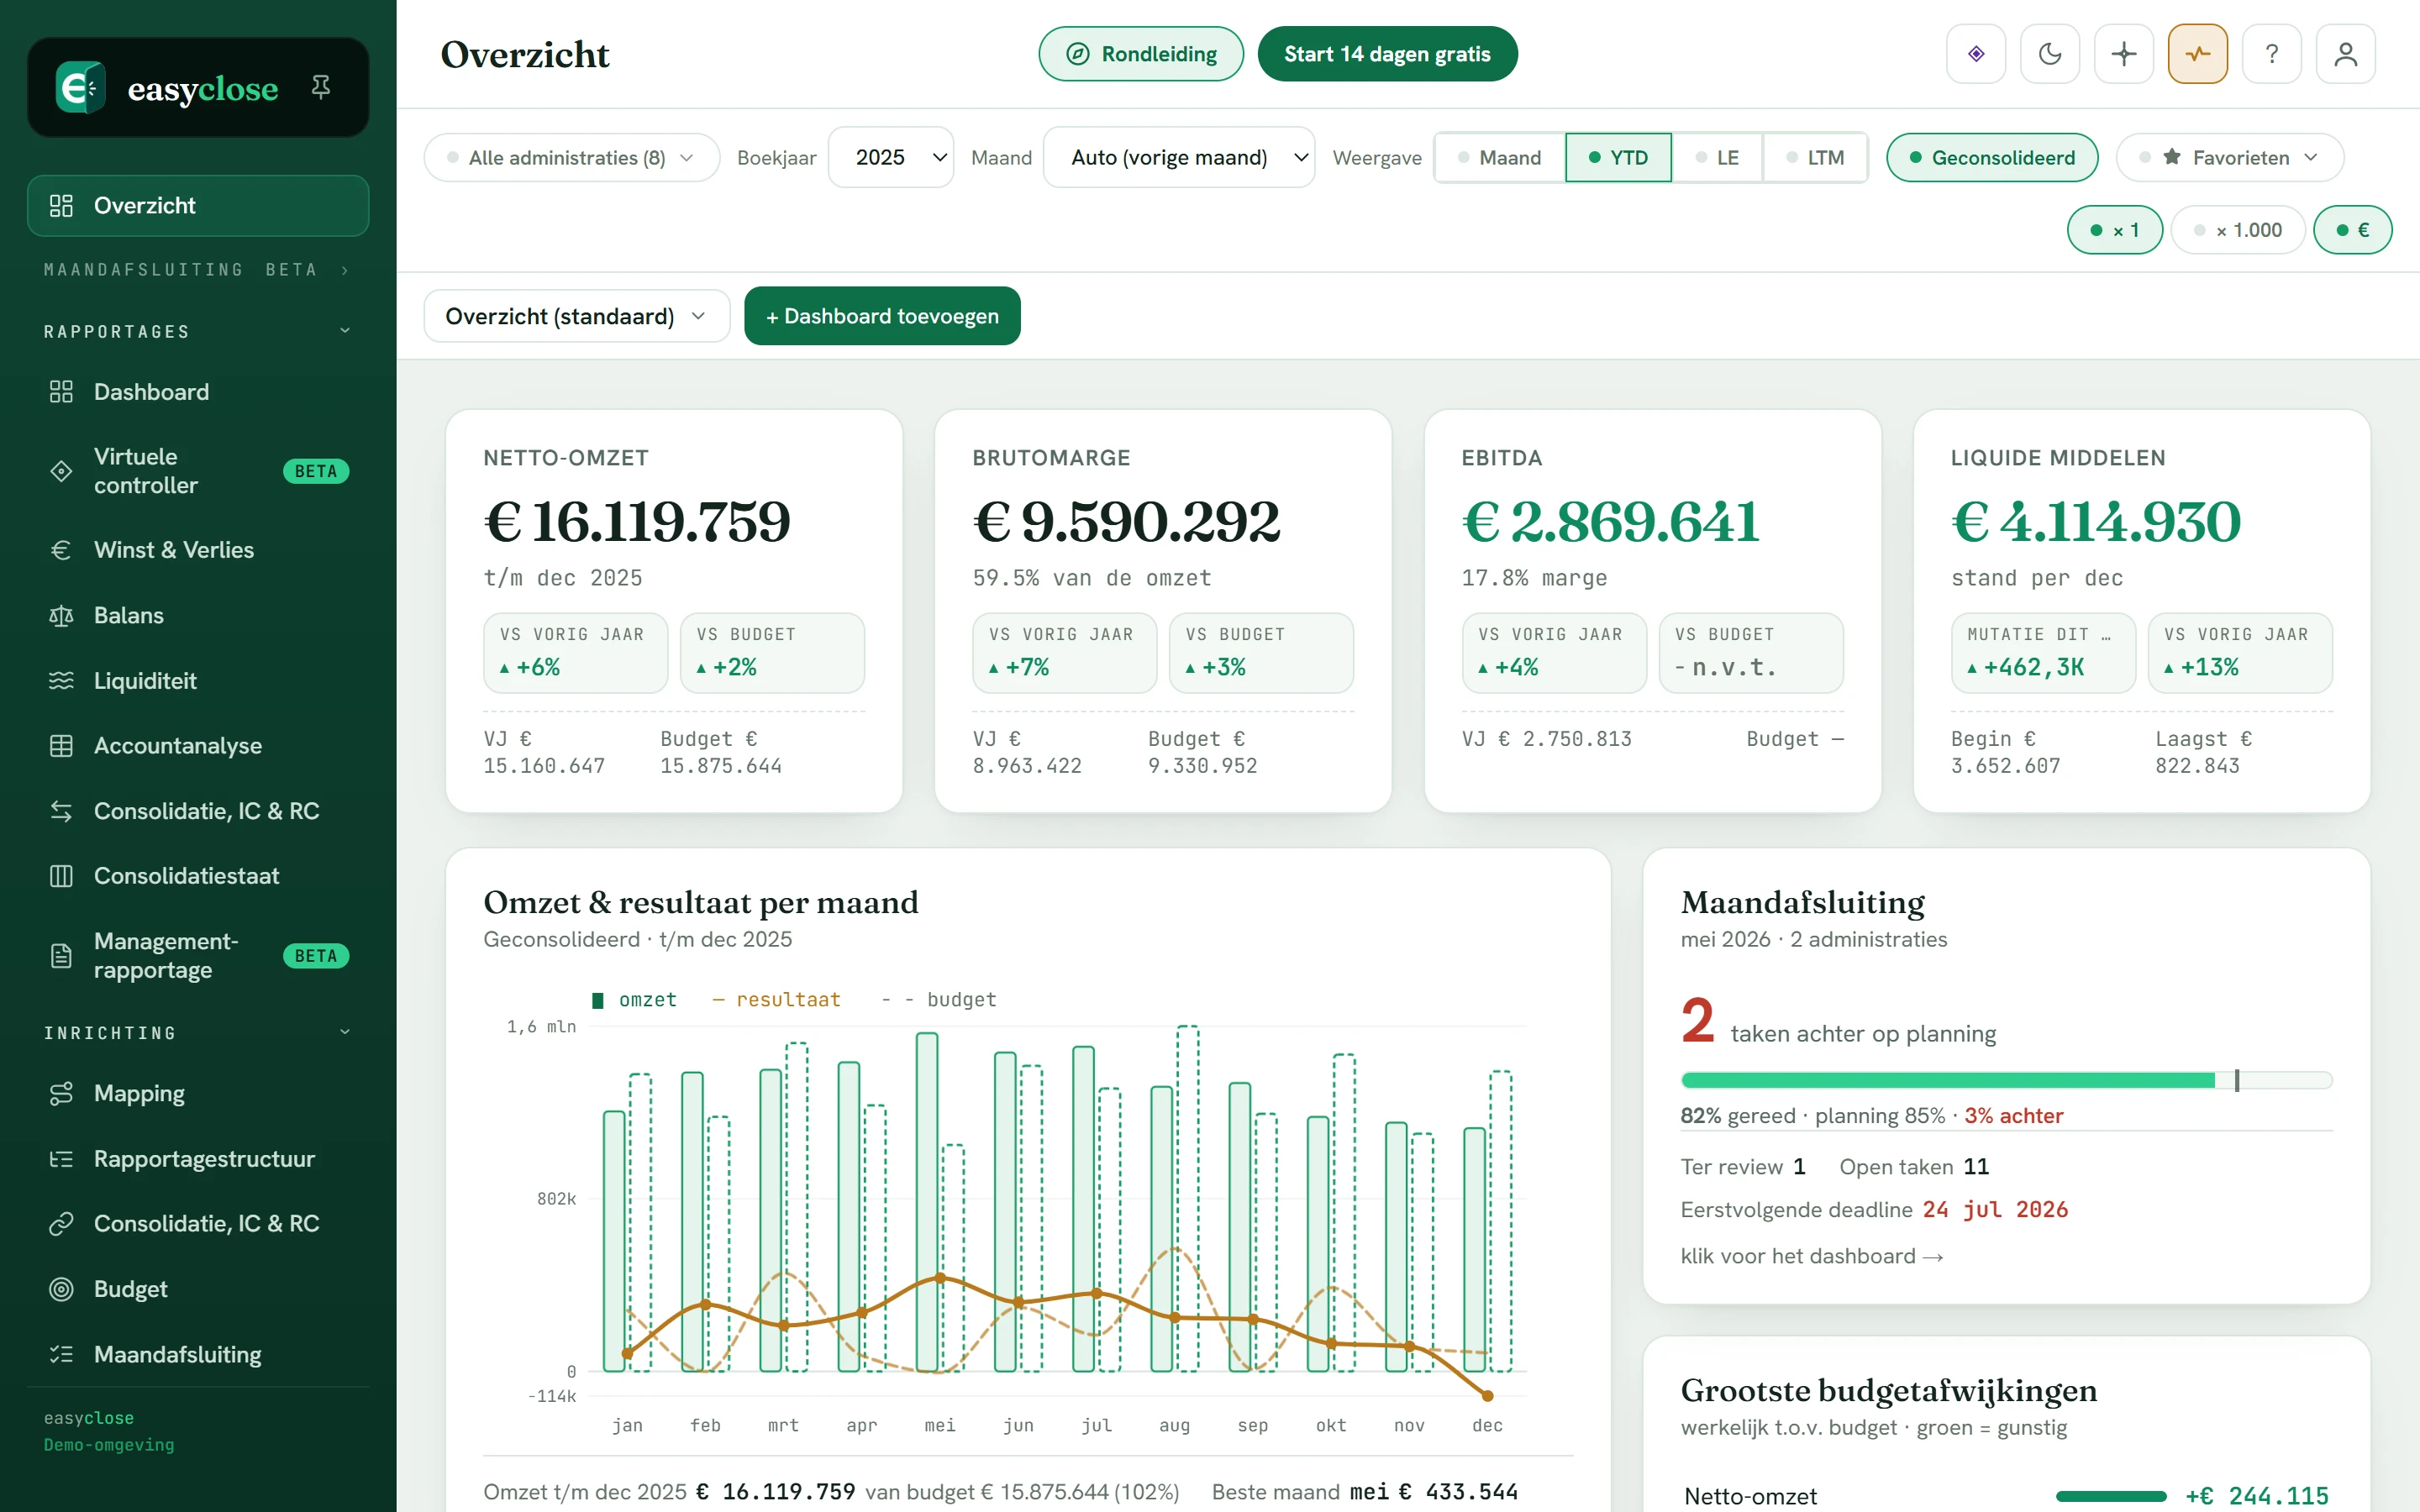
The key figures on one screen
The dashboard from the demo: KPIs with comparison chips, revenue and result per month and the close status. You can also build your own dashboards.
See it in the demo →Reporting for a group with multiple companies
If you have more than one company, then next to the reporting per entity you also want a consolidated view: the whole group as one, with the intragroup positions taken out. Easyclose consolidates automatically as soon as you record the group structure, with visible intercompany eliminations and an intercompany current account check that points out per month where a matching entry is missing. That way not only the individual reporting is right, but the group picture too.
Want to know when consolidation is legally required in the Netherlands? Read our guide to consolidated financial statements: the Dutch consolidation requirement, the exemptions and a step-by-step plan.
How Easyclose makes your reporting easy
Easyclose is Dutch financial reporting software, built by a controller. You import from every accounting package, set up your reporting structure once and the reports stand ready immediately. Operational within an hour, without an IT project or consultant.
Works with every package
Import your audit file (XAF) directly, or a free-form Excel or CSV where you map the columns yourself and save that profile. We roll out live connections package by package; the import always remains the fallback.
Set up once
Choose a reporting template or build your own categories, and map the general ledger accounts by dragging or via the AI mapping. From then on it applies to every month.
Ready immediately
Dashboard, P&L, balance sheet, cash flow and year-on-year comparison stand ready straight away, compared against last year or budget and with drill-down to the entry line.
EU hosting, strictly separated
Your data is stored encrypted within the EU (AWS Frankfurt). Every organisation sees only its own figures, enforced at database level.
MCP connection
Point your own AI at your figures via the MCP connection, with exactly the same access boundaries as you. The AI never sees more than the user is allowed to see.
For the group too
Multiple companies? The consolidated reporting comes on top, with visible eliminations and an intercompany current account check.
Want to know more about the building blocks? See the month-end close, consolidation, compare & budget, building dashboards or how we secure your data.
Frequently asked questions about financial reporting
What is financial reporting?
Financial reporting is presenting a company's figures in a clear, structured way, so that the board, owner, bank or accountant knows how the business is doing. The core consists of the profit and loss account (the result over a period), the balance sheet (assets and liabilities at a point in time) and the cash flow. A good management report sets those figures against last year, the budget or the previous period.
What belongs in a management report?
A management report typically contains a dashboard with key figures (KPIs), the profit and loss account, the balance sheet and the cash flow, each compared with last year and budget, plus a short commentary on the main variances. For a group with multiple companies, the consolidated reporting belongs there too. Most important of all, every item must be traceable: you must be able to click from a total back to the underlying entries.
Can financial reporting be done without Excel?
Yes. Reporting in Excel works, but costs time every month again with copying, checking formulas and keeping track of versions. Reporting software such as Easyclose builds the profit and loss, balance sheet, cash flow and dashboards automatically from your imported figures, compared against last year or budget and with drill-down to the entry line. You set up the structure once and every following month the report stands ready immediately.
What is drill-down in a report?
Drill-down means you can click through from a total figure to the details underneath it: from a category to the general ledger accounts, and from an account to the individual entry lines. That way you can substantiate every item in your report and explain a variance immediately. In Easyclose every amount in the reporting is clickable down to the entry line.
Does the reporting work with my accounting package?
Yes, with every package. You import an audit file (XAF) directly, or a free-form Excel or CSV where you map the columns yourself and save that profile for next time. We roll out direct live connections package by package; the import always remains available as a fallback, so you are never locked in to one vendor.
How quickly am I up and running?
With an import you are live within fifteen minutes; with a direct connection your data appears automatically. No implementation project, no consultant, no IT. Want to look around first? The demo on this site runs on fictitious figures and requires no account.
See your reporting in the demo
Open the demo with fictitious figures, or create a free environment and import your own audit file or Excel. See for yourself how dashboard, P&L, balance sheet and cash flow come together, with comparisons and drill-down.
- Dashboard, P&L, balance sheet, cash flow and year-on-year comparison
- Compare against last year, budget and the previous period
- Drill-down to the entry line
- Your own reporting structure and templates (Dutch GAAP (RJ), IFRS, industry)
- Consolidation for groups with multiple companies
- Works with every accounting package via audit file or Excel